Running Node Exporter on Pfsense
Using node_exporter to monitor pfsense
Why what where
I’m using Pfsense as my edge device in a small homelab-colocation running in Montreal. It’s running under ESXI as a VM but I still required some level of visibility.
Because $dayjob, I selected Prometheus as my central monitoring platform. The Prometheus stack is based around active scraping of “exporters” that are gathering data from local or remote source. By default, Pfsense does not provide an API or an endpoint that can be scraped and there is no such thing as a prometheus_exporter.
That said, Prometheus does offer a generic Linux exporter called node_exporter which was ported to FreeBSD.
It’s not available as a Pfsense bundle package so the installation process is a bit different. Do it at your own risk ;)
How to install node_exporter under Pfsense.
We can see that the FreeBSD port does exist here : https://www.freshports.org/sysutils/node_exporter
You will need to sudo package installed + ssh enabled to log into Pfsense directly.
It is available for FreeBSD 11 (which is what Pfsense is based on)
[2.4.5-RELEASE][[email protected]]/home/laurentdumont: sudo FreeBSD-version
11.3-STABLE
We can then install the package from our mirror.
sudo pkg add http://pkg.freebsd.org/FreeBSD:11:amd64/latest/All/node_exporter-1.0.1.txz
Fetching node_exporter-1.0.1.txz: 100%    3 MiB   3.3MB/s    00:01
Installing node_exporter-1.0.1...
Newer FreeBSD version for package node_exporter:
To ignore this error set IGNORE_OSVERSION=yes
- package: 1104001
- running kernel: 1103507
Ignore the mismatch and continue? [y/N]: y
Extracting node_exporter-1.0.1: 100%
=====
Message from node_exporter-1.0.1:

--
If upgrading from a version of node_exporter <0.15.0 you'll need to update any
custom command line flags that you may have set as it now requires a
double-dash (--flag) instead of a single dash (-flag).
The collector flags in 0.15.0 have now been replaced with individual boolean
flags and the -collector.procfs` and -collector.sysfs` flags have been renamed
to --path.procfs and --path.sysfs respectively.
You can see a warning for what seems to be a FreeBSD mismatch but I was able to accept the warning and go on my merry way.
Things have been running for a few days without any fires so it seems rather safe. I’m not sure how Pfsense itself will deal with the extra package if I do an upgrade of the OS so that remains to be seen…
[2.4.5-RELEASE][[email protected]]/home/laurentdumont: node_exporter --help
usage: node_exporter [<flags>]

Flags:
  -h, --help                    Show context-sensitive help (also try --help-long and --help-man).
      --collector.filesystem.ignored-mount-points="^/(dev)($|/)"
                                Regexp of mount points to ignore for filesystem collector.
      --collector.filesystem.ignored-fs-types="^devfs$"
                                Regexp of filesystem types to ignore for filesystem collector.
      --collector.netdev.device-blacklist=COLLECTOR.NETDEV.DEVICE-BLACKLIST
                                Regexp of net devices to blacklist (mutually exclusive to device-whitelist).
      --collector.netdev.device-whitelist=COLLECTOR.NETDEV.DEVICE-WHITELIST
                                Regexp of net devices to whitelist (mutually exclusive to device-blacklist).
      --collector.ntp.server="127.0.0.1"
                                NTP server to use for ntp collector
      --collector.ntp.protocol-version=4
                                NTP protocol version
      --collector.ntp.server-is-local
                                Certify that collector.ntp.server address is not a public ntp server
      --collector.ntp.ip-ttl=1  IP TTL to use while sending NTP query
      --collector.ntp.max-distance=3.46608s
                                Max accumulated distance to the root
      --collector.ntp.local-offset-tolerance=1ms
                                Offset between local clock and local ntpd time to tolerate
      --path.procfs="/proc"     procfs mountpoint.
      --path.sysfs="/sys"       sysfs mountpoint.
      --path.rootfs="/"         rootfs mountpoint.
      --collector.runit.servicedir="/etc/service"
                                Path to runit service directory.
      --collector.supervisord.url="http://localhost:9001/RPC2"
                                XML RPC endpoint.
      --collector.textfile.directory=""
                                Directory to read text files with metrics from.
      --collector.boottime      Enable the boottime collector (default: enabled).
      --collector.buddyinfo     Enable the buddyinfo collector (default: disabled).
      --collector.cpu           Enable the cpu collector (default: enabled).
      --collector.exec          Enable the exec collector (default: enabled).
      --collector.filesystem    Enable the filesystem collector (default: enabled).
      --collector.loadavg       Enable the loadavg collector (default: enabled).
      --collector.meminfo       Enable the meminfo collector (default: enabled).
      --collector.netdev        Enable the netdev collector (default: enabled).
      --collector.ntp           Enable the ntp collector (default: disabled).
      --collector.runit         Enable the runit collector (default: disabled).
      --collector.supervisord   Enable the supervisord collector (default: disabled).
      --collector.textfile      Enable the textfile collector (default: enabled).
      --collector.time          Enable the time collector (default: enabled).
      --collector.uname         Enable the uname collector (default: enabled).
      --collector.zfs           Enable the zfs collector (default: enabled).
      --collector.devstat       Enable the devstat collector (default: disabled).
      --web.listen-address=":9100"
                                Address on which to expose metrics and web interface.
      --web.telemetry-path="/metrics"
                                Path under which to expose metrics.
      --web.disable-exporter-metrics
                                Exclude metrics about the exporter itself (promhttp_*, process_*, go_*).
      --web.max-requests=40     Maximum number of parallel scrape requests. Use 0 to disable.
      --collector.disable-defaults
                                Set all collectors to disabled by default.
      --web.config=""           [EXPERIMENTAL] Path to config yaml file that can enable TLS or authentication.
      --log.level=info          Only log messages with the given severity or above. One of: [debug, info, warn, error]
      --log.format=logfmt       Output format of log messages. One of: [logfmt, json]
      --version                 Show application version.
Once the package has been installed, you can start it with.
sudo service node_exporter onestart
This starts the node_exporter service but will not auto-start if Pfsense does reboot.
[2.4.5-RELEASE][[email protected]]/home/laurentdumont: level=info ts=2020-11-03T17:08:58.360Z caller=node_exporter.go:177 msg="Starting node_exporter" version="(version=1.0.1, branch=release-1.0, revision=0)"
level=info ts=2020-11-03T17:08:58.360Z caller=node_exporter.go:178 msg="Build context" build_context="(go=go1.15.2, user=root, date=)"
level=info ts=2020-11-03T17:08:58.360Z caller=node_exporter.go:105 msg="Enabled collectors"
level=info ts=2020-11-03T17:08:58.360Z caller=node_exporter.go:112 collector=boottime
level=info ts=2020-11-03T17:08:58.360Z caller=node_exporter.go:112 collector=cpu
level=info ts=2020-11-03T17:08:58.360Z caller=node_exporter.go:112 collector=exec
level=info ts=2020-11-03T17:08:58.360Z caller=node_exporter.go:112 collector=filesystem
level=info ts=2020-11-03T17:08:58.360Z caller=node_exporter.go:112 collector=loadavg
level=info ts=2020-11-03T17:08:58.360Z caller=node_exporter.go:112 collector=meminfo
level=info ts=2020-11-03T17:08:58.360Z caller=node_exporter.go:112 collector=netdev
level=info ts=2020-11-03T17:08:58.361Z caller=node_exporter.go:112 collector=textfile
level=info ts=2020-11-03T17:08:58.361Z caller=node_exporter.go:112 collector=time
level=info ts=2020-11-03T17:08:58.361Z caller=node_exporter.go:112 collector=uname
level=info ts=2020-11-03T17:08:58.361Z caller=node_exporter.go:112 collector=zfs
level=info ts=2020-11-03T17:08:58.361Z caller=node_exporter.go:191 msg="Listening on" address=:9100
level=info ts=2020-11-03T17:08:58.361Z caller=tls_config.go:170 msg="TLS is disabled and it cannot be enabled on the fly." http2=false
level=error ts=2020-11-03T17:08:58.840Z caller=collector.go:161 msg="collector failed" name=zfs duration_seconds=1.7671e-05 err="couldn't get sysctl: no such file or directory"

[2.4.5-RELEASE][[email protected]]/home/laurentdumont:
[2.4.5-RELEASE][[email protected]]/home/laurentdumont:
[2.4.5-RELEASE][[email protected]]/home/laurentdumont: sudo ps aux | grep node_exporter
laurentdumont 60965   0.0  0.8 722916 17296  1  S    17:08       0:00.01 node_exporter
laurentdumont 61329   0.0  0.1   6560  2332  1  S+   17:09       0:00.00 grep node_exporter
You can test it by accessing : http://IP_OF_PFSENSE:9100/metrics
And it works!
# HELP node_network_receive_bytes_total Network device statistic receive_bytes.
# TYPE node_network_receive_bytes_total counter
node_network_receive_bytes_total{device="em0"} 2.24300166503e+12
node_network_receive_bytes_total{device="em1"} 3.401224344e+09
node_network_receive_bytes_total{device="em2"} 1.558897176e+09
node_network_receive_bytes_total{device="enc0"} 0
node_network_receive_bytes_total{device="lo0"} 105356
node_network_receive_bytes_total{device="ovpns1"} 2.28780693e+08
node_network_receive_bytes_total{device="pflog0"} 0
node_network_receive_bytes_total{device="pfsync0"} 0
# HELP node_network_receive_drop_total Network device statistic receive_drop.
# TYPE node_network_receive_drop_total counter
node_network_receive_drop_total{device="em0"} 0
node_network_receive_drop_total{device="em1"} 0
node_network_receive_drop_total{device="em2"} 0
node_network_receive_drop_total{device="enc0"} 0
The FreeBSD ports of node_exporter seems rather limited and is missing some stuff I’d like to export (like total sessions, UDP/TCP stats). Looking at the Github node_exporter page, these are just not supported for FreeBSD :(
The next step would be to try the NetData Prometheus integration and see if it provides more information.
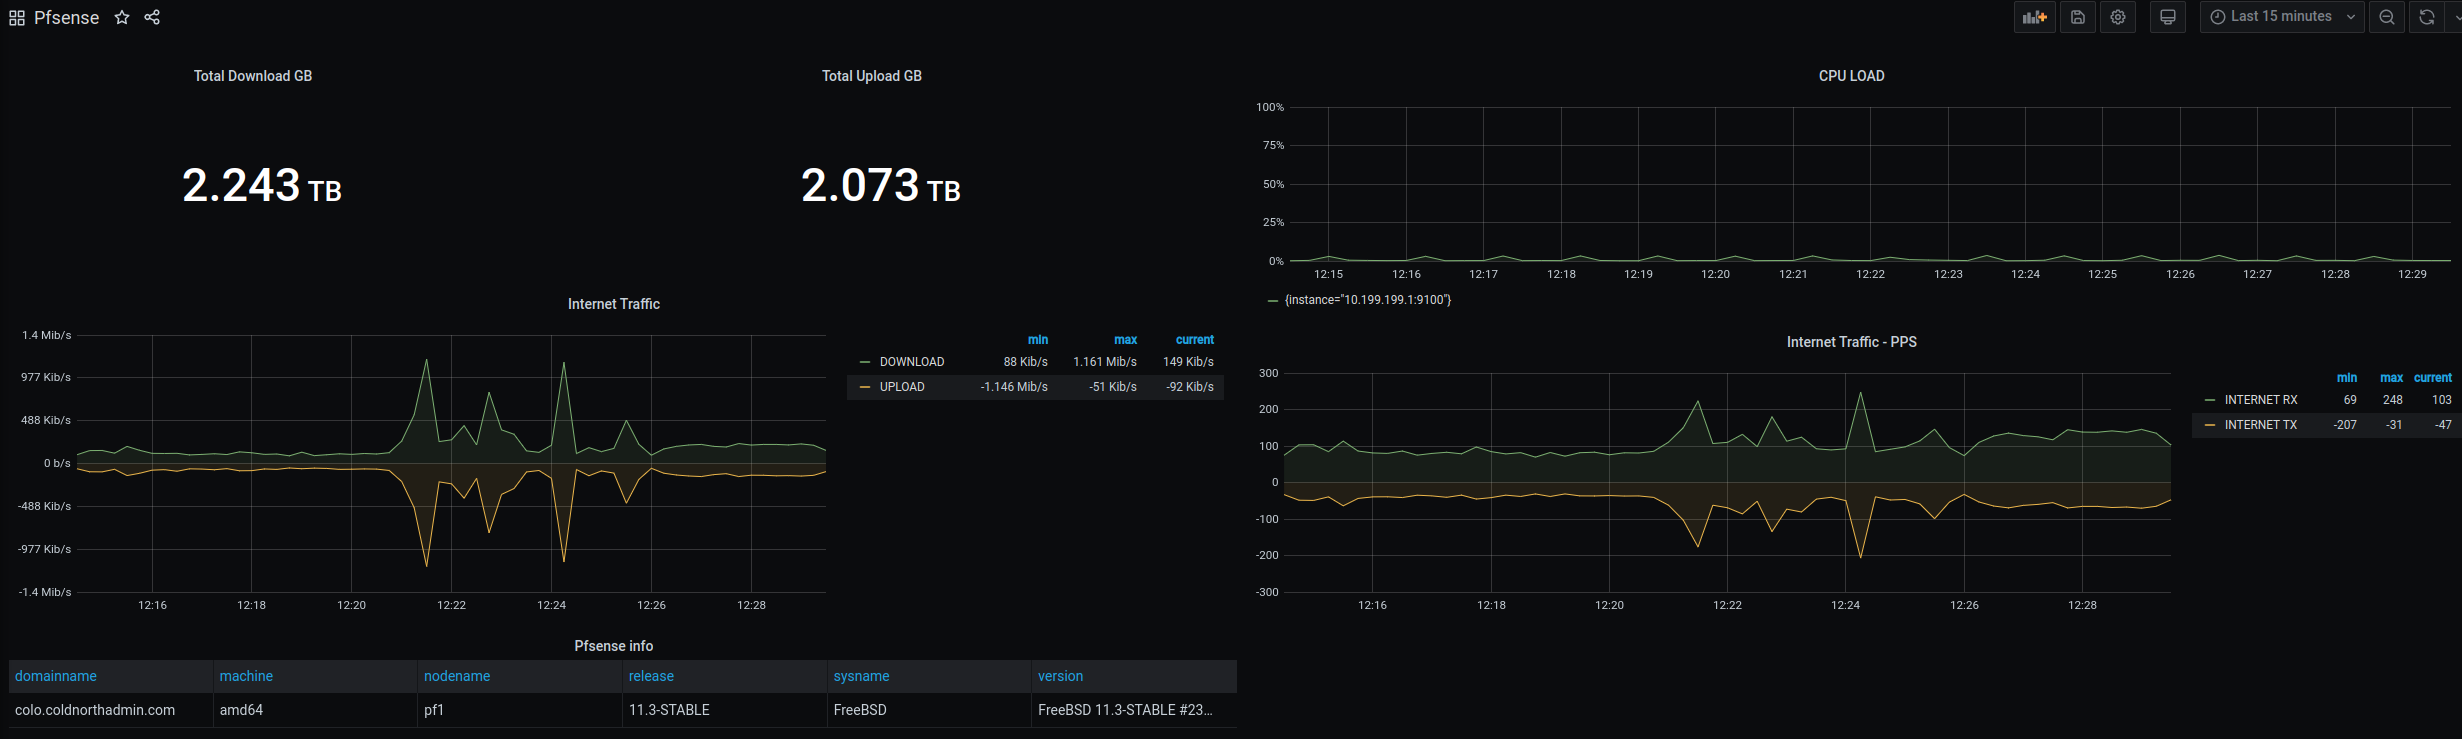
We can then graph the data in Grafana!