Just print your critical alerts
A better way to manage on-call alerts.
Alerting is a tough thing to balance.
- You either get too many alerts or too little.
- How do you figure out if an alarm is an actual incident?
- How do you make sure that the relevant teams are looking at the issue?
This is not an attempt to answer any of those questions.
This is me trying to find some kind of use out of a 50$ impulse Ebay buy…
Please do not do this in $production ;)
The beginning of madness
I bought an Okidata Microline 184 TURBO! 9 pin printer.
Just look at that amazing turbo logo. You know it goes fast by just looking at it.

Why?
I’m not 100% sure but I feel like part of my brain was hardwired to associate the sound of dot matrix printing to reliability and comfort. But I’m too young to have even owned one so I have no idea where that fascination comes from.
Just listen to that amazing purr (not my exact model but the sound is close enough).
https://youtu.be/A_vXA058EDY?t=33
Finding something to do with it.
So after a delivery (that required some explaining to the significant other), I figured I might as well find a use for it.
At $DAYJOB, we process alarms. A lot of alarms. Some alarms are good, some alarms are bad. Some are noise, some are significant. Part of the work of a DEVOPs team is to drive the vision that alarms should mean something and that too many alarms is as worse as too little.
But, when your logic is good, you want to make sure that critical alarms are properly highlighted.
Now, this is podracing (printing)!
This is where I thought that I could maybe get the printer doing something useful.
I run a small homelab of a couple of Dell R610 / R720 (blog post on those coming later). These are running Proxmox, ESXI and Kubernetes clusters. I have some alerting setup with the Prometheus stack and I figured I could give myself some visibility on the alerts! Sure, I could use Slack, SMS or Email. But printing is where it’s at. It’s reliable and makes enough noise to wake you up at 3 in the morning. Take that Pager Duty!
Overview of the flow
- Prometheus has a rule configured for X state.
- State is triggered
- Prometheus sends the alert to Alertmanager
- Alertmanager has a webhook receiver configured which means the alert is sent to IP:PORT as a webhook
- I have a small FastAPI application running.
- FastAPI takes the JSON from the alert, parses the bits that we need and sends the print request to the printer.
- The printer is connected to a laptop over a IEEE1284 cable (https://www.amazon.ca/gp/product/B01117NOYO/ref=ppx_yo_dt_b_asin_title_o06_s00?ie=UTF8&psc=1)
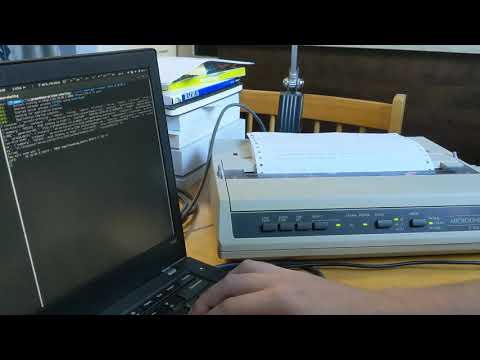
What it looks like in action (click on it!)
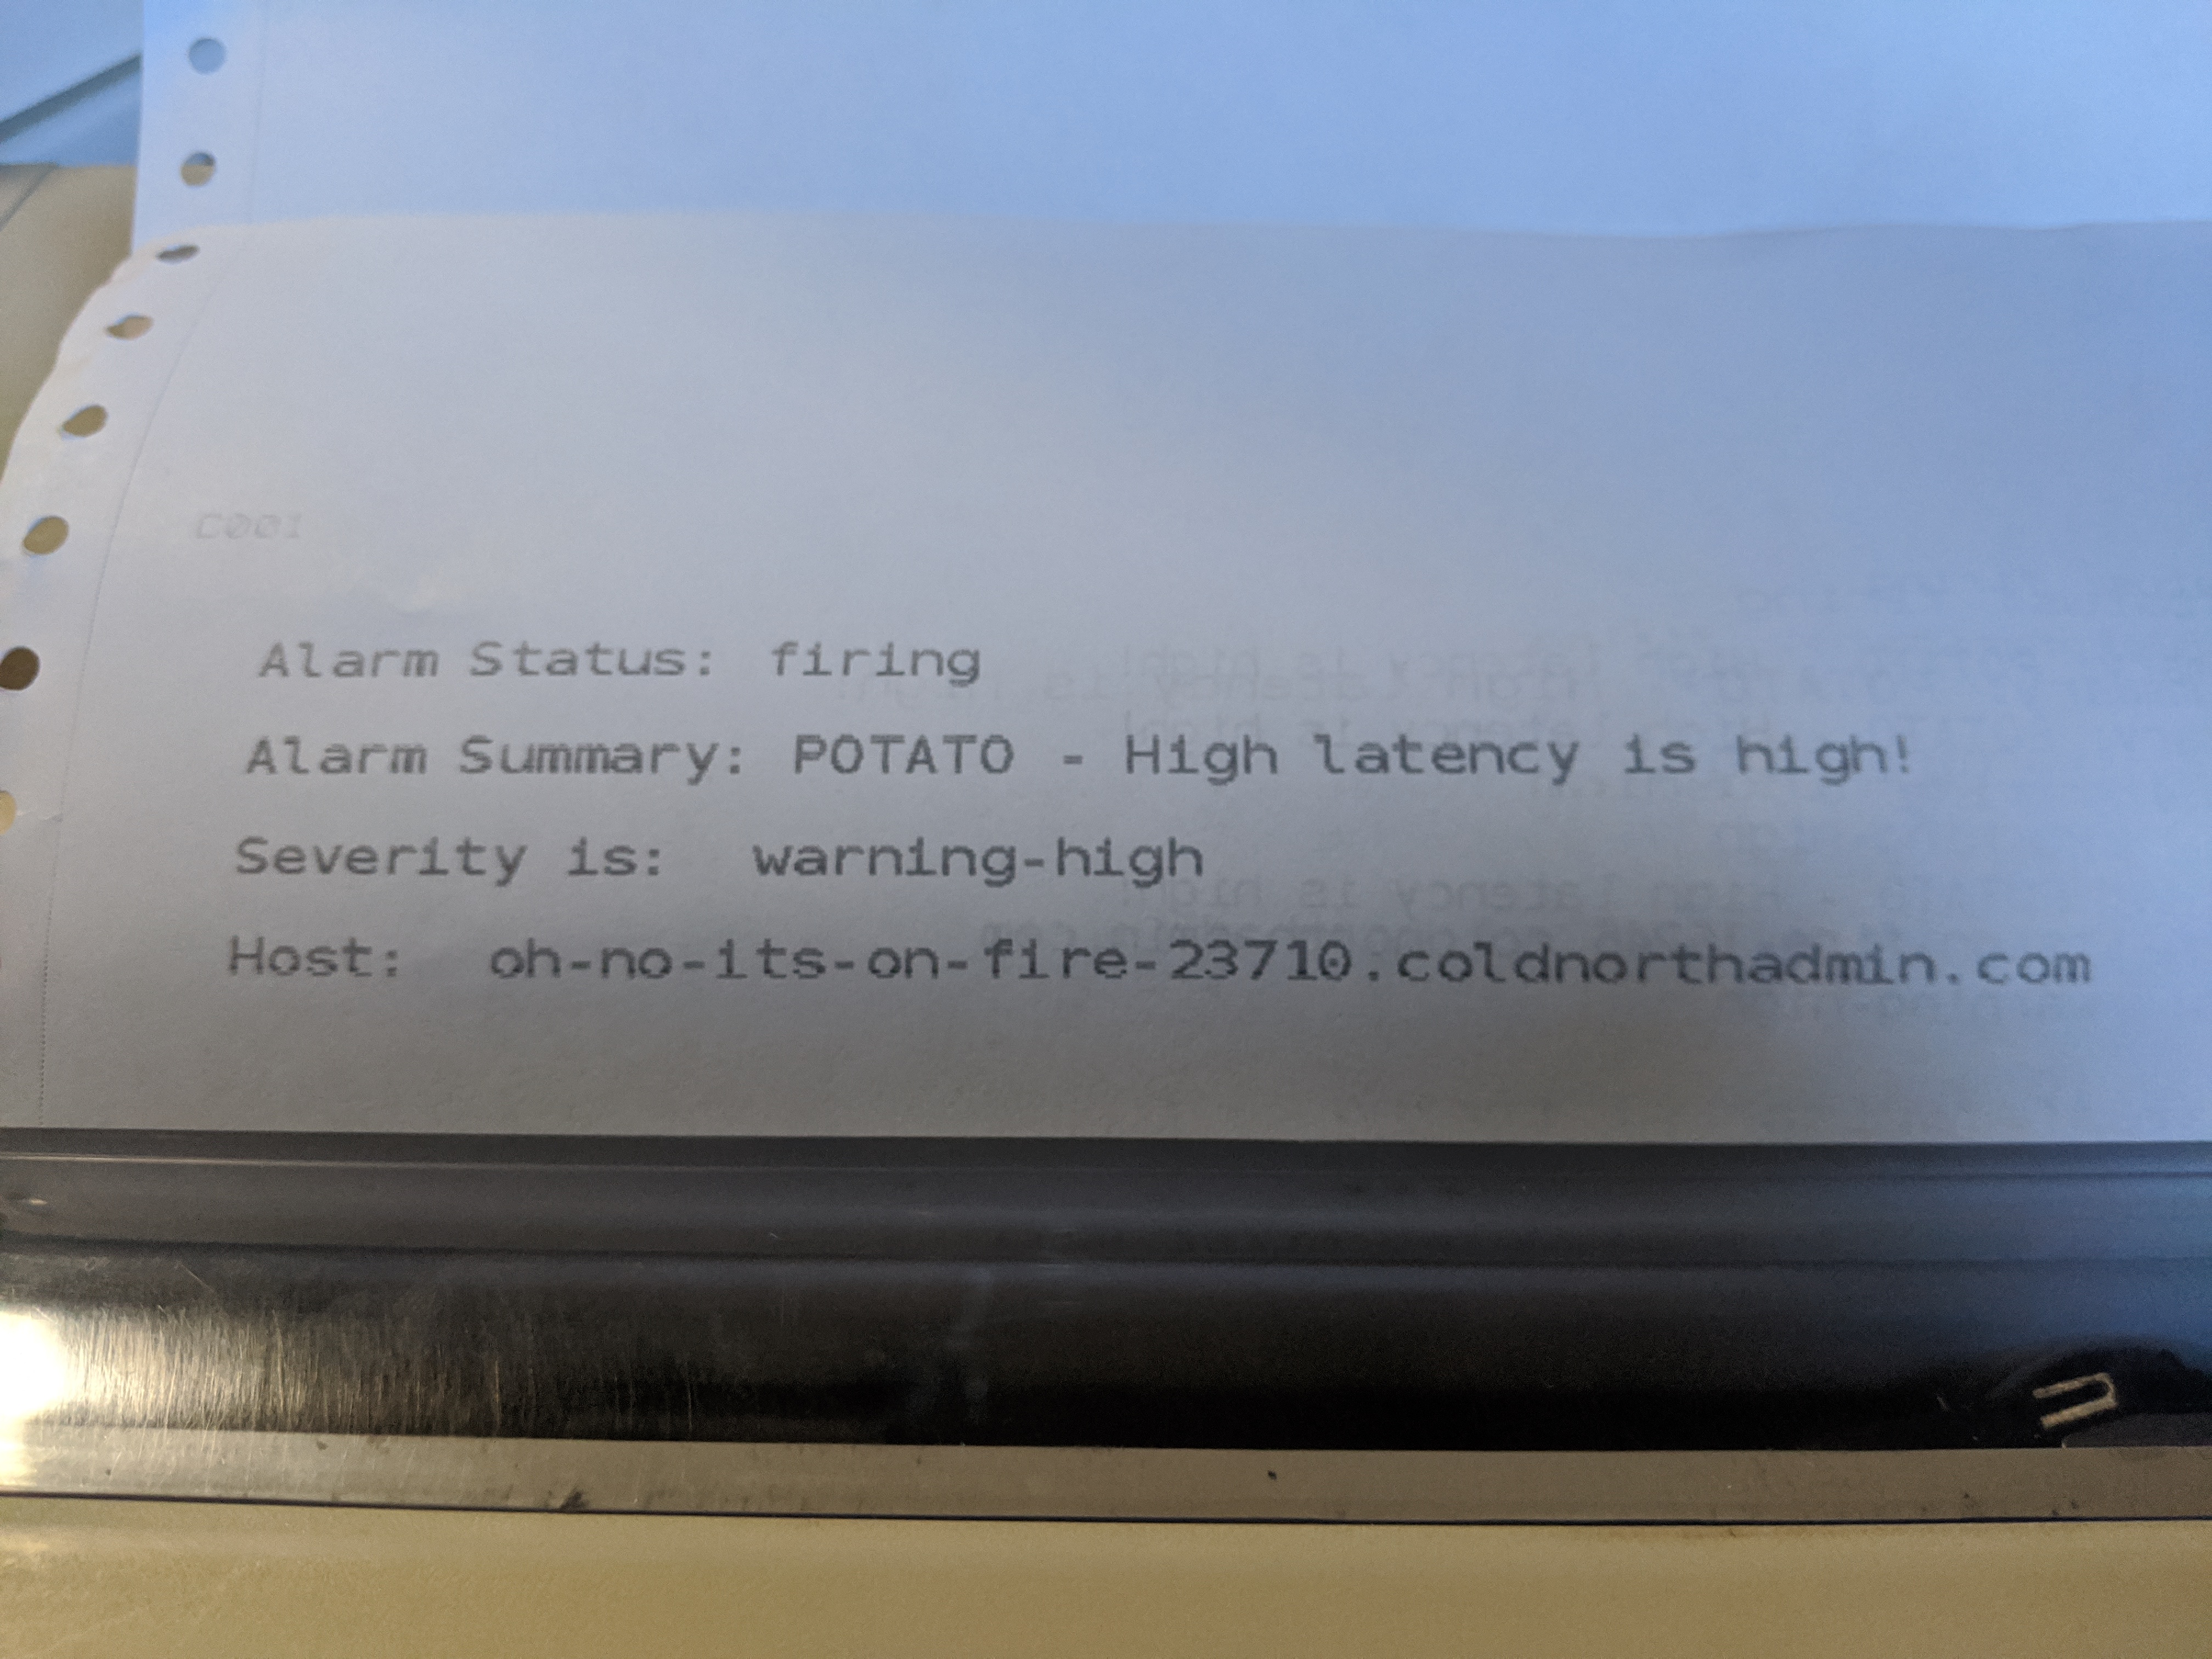
Final Result

You can bet I’m not going to miss any of those alerts now!
Links : - Code is here : https://github.com/LaurentDumont/prometheus-proxy-printer
